
Role
Service Designer/ Researcher
Team
1 x Product Owner, 1 x Product Manager, 2 x Business Analysts, 2 x Technical Architects, 1 x Product Designer, UI Designers, Many Developers.
Industry
Oil & Gas
Timeframe
12 Months
Shell Mobility Division
Designing a Real-Time Field Operative Service Ecosystem
Shell Mobility Division is revolutionising traditional automotive business models by leveraging digital techn-
ology to create a cleaner, more sustainable mobility future.
By integrating user research, design thinking, and collaboration, the programme enhances real-time site management for frontline field teams.
It helps streamline daily tasks, make on-site work more efficient, respond to customer needs faster, and ultimately improve overall service delivery performance, shaping the future of mobility services

Challenges
Identifying Operational Friction & addressing operative & organization values
Field operations across multiple countries were experiencing coordination inefficiencies, resulting in significant productivity loss and reduced trust in the fleet-management application. Operatives were losing on an average 80 minutes per day due to planning gaps, unclear job sequencing, and inconsistent system behaviours.
My project aimed to identify the systemic root causes behind these inefficiencies and establish a shared operational framework that aligned user behaviour, product logic, and business KPIs, enabling a more reliable and coordinated field service model.
Chargeable/Transit Time Correction Requests
40 per 100 Jobs
Manual Adjustment Rate
40%
Impact
Low Trust + Increased Admin effort
Approaches
Exploring Policies, Operating models, Data & System limitations
Cross-Collaboration
After the new fleet management app was launched, I stepped in to understand why frontline operatives were struggling to integrate it into their daily workflows. I understood the business & unclear feedback by examining how the system was being used across regions.
Initially through workflow analysis, I identified fragmented processes, unreliable time tracking, and inconsistent job coordination. I highlighted the gaps and explained that the service needed deeper changes, not just small interface fixes.


Direction
After the initial discovery work, I structured the research into clear stages planning, forming hypotheses, conducting research, and drawing insights.
Although it sounds linear, the process was flexible. I kept revisiting assumptions and refining focus as new findings emerged.
Based on stakeholder interviews and early feedback, I developed three core hypotheses.
These connected potential features to real user goals, such as improving daily task planning, making image capture more accurate, and tracking transit time more reliably.
Research Strategy & Execution
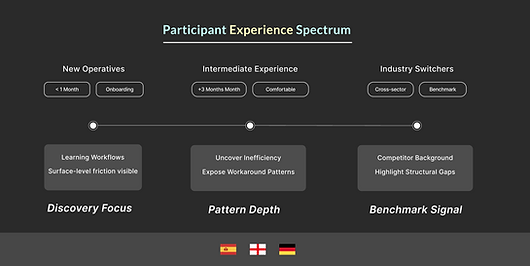
To ensure the research reflected real operational differences, I selected three key regions with the highest volume of work orders. This helped capture variations in local workflows and working conditions.
I recruited operatives across experience levels , new joiners, intermediate users, and industry switchers. This ensured I understood both onboarding challenges and experienced-user workarounds.
To understand how the app was actually used in the field, I used two methods.
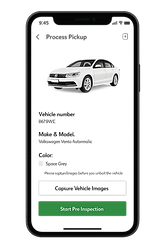
First, I conducted a “day in the life” study, where operatives recorded themselves during a typical workday. This revealed real usage patterns and hidden friction points.
Second, I ran in-depth interviews using dummy orders to walk through key screens. This helped gather detailed feedback on planning, image capture, and transit time tracking.
Insight Discovery
Uncovering key challenges and opportunities
I broke each interview into smaller micro sections - key highlights, pain points, surprises, and behaviours - to deeply understand individual mental models rather than just surface feedback.
I then clustered these micro insights across participants to identify recurring patterns. Using a simple What-Why-How lens, I translated these patterns into clear insights that connected user behaviour to root causes and potential design directions.

Outcome

Stakeholder Alignment / Ownership Distribution

Identifying Touchpoints
Uncovering Hidden Workflow Gaps Across the Service Journey
Through journey mapping and field validation, I identified critical touchpoints where the system failed to align with real-world workflows. Operatives were relying on multiple external tools such as Telegram, WhatsApp, Apple Maps, and manual timestamps due to low trust in the app’s time tracking, navigation, and coordination features.
The analysis revealed systemic friction, unclear scheduling, unreliable play/pause logic, limited post-submission review, weak feedback loops, and missing audit notes. These gaps highlighted how the app lacked visibility, flexibility, and operational coherence, directly impacting planning accuracy, coordination.
Outcome
Touchpoints deviating from the usual journey that is not recorded in th system.


Ideation & Workshops
Turning Insights into Prioritised, Actionable Solutions
Following the identification of key pain points and touchpoints, we moved into structured ideation to translate research into improvements.
The objective was to generate as many solutions and directions around workflows, planning, image capture, and chargeable time, so they felt simpler, clearer, and more integrated for operatives.
Through a series of co-design workshops with product owners, implementation leads, UX designers, and frontline operatives, we aligned on the most impactful opportunities. Using dot voting, teams tagged and assigned ownership to user stories, ensuring clear accountability across business, UX, and development.
I reframed priority pain points into How Might We questions and generated rapid ideas through Crazy 8’s. All requirements were then structured and prioritised using the ABCDE method, creating clarity on what must be delivered first.
Outcome
-
Clearly tagged and assigned user stories
-
A prioritised action plan aligned to sprint delivery
-
A consolidated insight report for internal reference


Storytelling and Influencing
Bridging Teams Through Visual Storytelling
To help business, technology, and field teams understand the future experience, I used storyboarding to make it visible. Rather than talking through the chargeable time issue in abstract terms, I created real-life scenarios, like an operative 'waiting for the driver', or 'reached customer location', to show what actually happens on the ground. These illustrations revealed how a single action, "Start Trip," was being interpreted in completely different ways by different teams. By showing the journey through the operative's eyes, stakeholders could see the root cause clearly, agree on what was actually going on, and understand how the experience be in the future.

Operative Value Framework
Aligning Cross-Fleet Decisions Through a Shared User Lens
I noticed that separate teams designing for small and large fleets were solving problems independently, with no shared goals or common measures of success.
Through research, I identified the need for a common structure that could align decisions across projects. I designed the Operative Value Framework — mapping operative needs across key journey stages with measurable KPIs like travel, inspection, and idle time.
After validating it within my own project, I presented it to senior stakeholders. Leadership adopted it as a shared agenda across all fleet projects, improving team alignment, reducing duplicated work, and creating a more consistent experience for operatives across fleet types.

Usability Testing and Iteration
Embedding Continuous Feedback into Product Development
I led moderated one-on-one remote usability sessions, grouping similar functions together, and diving into different parts and sessions.
For features where we had competing design directions, I ran A/B tests, presenting each variant to a different subset of operatives and comparing task completion time, navigation errors, and preference. Verbal feedback was equally valuable, like "This feels faster" or "Now I know what picture is missing". I logged all findings, as continuous improvement of tickets, feeding directly into developer sprint cycles. Bi-weekly stakeholder readouts kept priorities evolving.
The iterative cycle progressively closed action items across the journey, bringing transparency of progress and directly informed the Operative Value Framework and ongoing Service Blueprint for the project’s next release.

Service Blueprint
Operating Model Transition
The service blueprint was used to represent and operationalise the transition in the operating model. The organisation had already identified that the existing 1 Job–1 Operative–1 Car model was leading to excessive vehicle usage and long waiting periods for operatives.
Through the blueprint, I mapped how the new 1 Job – 2 Operatives model would function across the service journey, clearly visualising the coordination between shuttle drivers, operative drop-offs, job execution, and return logistics. This helped align business, product, and operational teams on how the new workflow would work in practice and what system changes were required to support it through backend. By making the transition visible across frontstage actions, backend processes, and operational dependencies, the blueprint provided a shared implementation guide for the new operating model. This shift ultimately reduced daily avoidable idle time from around 80 minutes to 60 minutes per operative, a 25% improvement, unlocking approximately 293 productive hours per month across 40 operatives and significantly improving field utilisation.

Learning and Reflection
The Shell Mobility project changed how I think about service design. Initialy I was skeptical about project being concentrated on interfaces and user flows, but I left with a much broader understanding of what it actually takes to improve a service at scale.
In complex enterprise environments, the real challenge is rarely the screen. It is getting the right people, operatives, product owners, engineers, and business stakeholders — to understand the same problem in the same way, and then make decisions together that actually stick. I learned that design work only has impact when it connects to how teams operate and aligns with system.
Working directly with frontline operatives showed me how much a small design decision can ripple outward. A single field on a form, a label that is slightly ambiguous, or a step that adds thirty seconds to a task, these things affect data accuracy, operational efficiency, and how much operatives trust the tools they are given every day. That kind of detail only becomes visible when you spend time with the people doing the actual work.
I also learned that insight on its own is not enough. Research findings need to be translated into something teams can act on.
Perhaps the biggest lesson was about influence. Getting a feature built is one thing and getting a team to redesign something from the ground up requires a different kind of work. That is where storytelling and visualisation became just as important as the research itself. When stakeholders can see the operative's experience laid out in front of them, conversations shift from opinion to understanding.
This project reinforced that the most valuable thing a service designer can do is build that shared understanding and then keep it alive as the product evolves.